


My identity as a graphic designer (at this point in time) is as a graphic activist. While I take the inspiration from Shepard Fairey and Banksy, my style of it would be to visualize data and research to help build awareness of our political and economic dissonance. I think this next set of graphics will help to show how I identify myself in my work.
The first graphic turned out to be a mainstay graphic for the organization. Many publication were designed in this style after this one, with many updates, as well, to this graphic as the research expanded. The source is our own research and practical application of what we called the Cleveland Model.
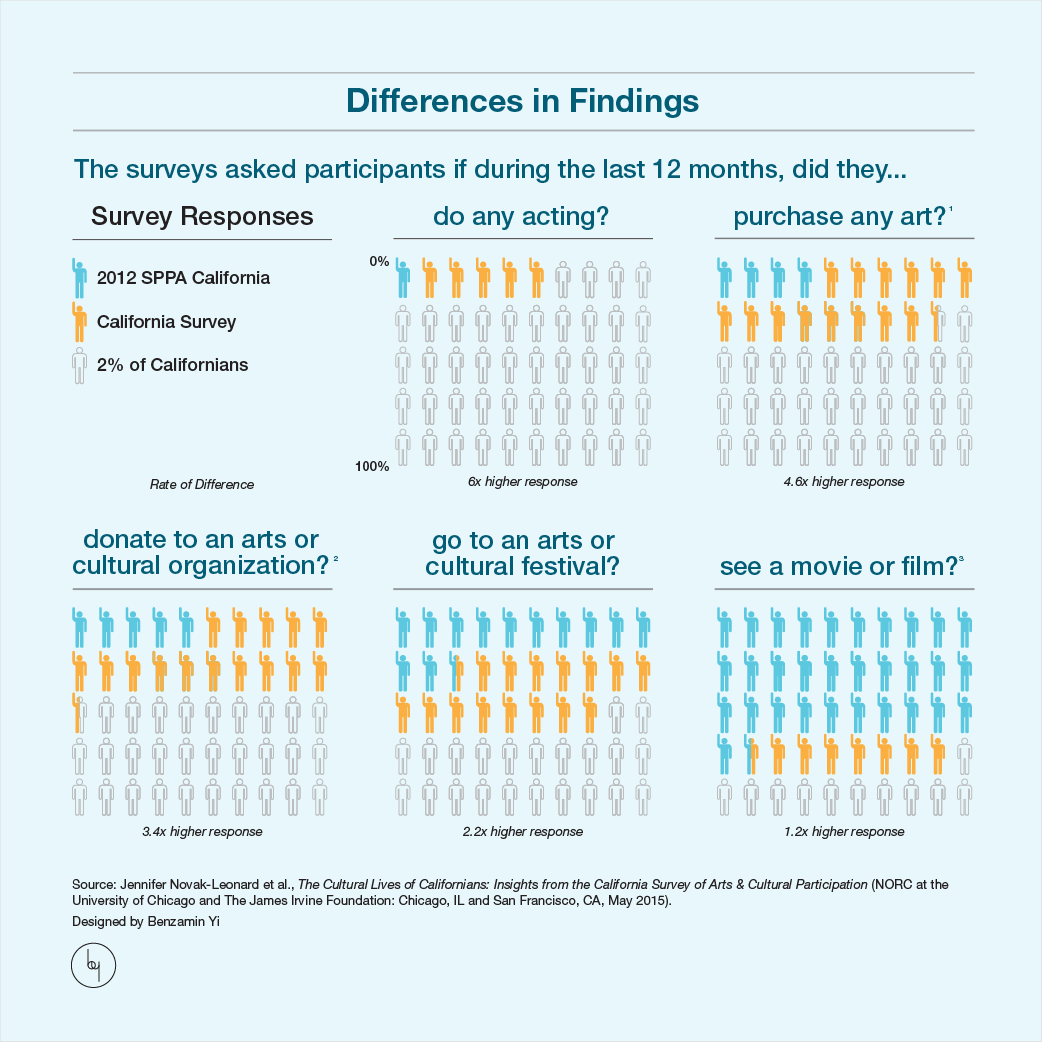
The second graphic was created based on an article by Createquity, with the research for this particular set of data done by Jennifer Novak-Leonard et al., The Cultural Lives of Californians: Insights from the California Survey of Arts & Cultural Participation (NORC at the University of Chicago and The James Irvine Foundation: Chicago, IL and San Francisco, CA, May 2015). In this instance, I was given the research to create an infographic from it.
The third graphic is a GIF of multiple graphs I created with very meticulous research done by myself and my colleagues. The sources are various, but they come from the Bureau of Labor Statistics, U.S. Census, National Oceanic and Atmospheric Administration, U.S. Department of Justice, White House Historical Tables, and The World Top Income Database.